
Measuring Success: KPIs for Agentic AI in Data Quality Management
Agentic AI systems now monitor, correct, and negotiate data integrity across enterprise systems. They operate semi-autonomously, making decisions that once required human judgment. But here's the challenge: how do we know they're actually performing well? Success in this new paradigm isn't just about accuracy. It's about trust, speed, resilience, and measurable business impact.
Why KPIs Matter in Agentic Data Quality
The shift from manual data cleansing to autonomous and semi-autonomous agents has created a measurement gap. Traditional data quality metrics like completeness, validity, and timeliness tell us about the state of our data, but they fall short when we need to evaluate agent performance.
We're no longer just measuring data health. We're measuring agent behavior, decision-making quality, collaboration effectiveness, and business outcomes. The question isn't simply "Is our data clean?" It's "Are our agents cleaning data effectively, safely, and in ways that create value?"
This requires a new approach. Organizations need multi-dimensional KPIs that capture data state, agent behavior, business impact, and trust alignment. Measuring agentic AI performance means tracking accuracy, autonomy, speed, collaboration quality, and long-term value creation simultaneously.
The New Performance Reality: Agent vs. Human vs. Hybrid Outcomes
Agent-driven workflows differ significantly from rule-based automation. Traditional data quality tools execute predefined logic: if condition X exists, apply transformation Y. Agentic systems make contextual judgments, learn from patterns, and adapt their strategies over time.
In hybrid environments, which most enterprises operate today, agents detect anomalies, collaborate with human data stewards, and escalate conflicts when confidence thresholds aren't met. This creates a measurement challenge. Too simple a KPI framework becomes misleading, suggesting success when critical issues hide beneath the surface. Too complex a framework becomes unusable, overwhelming teams with data they can't act on.
The solution is a KPI framework that balances comprehensiveness with usability. Metrics must be actionable, benchmarkable, and directly tied to business value. They should reveal not just what's happening, but why it matters and what to do about it.
A Four-Layer KPI Framework for Agentic Data Quality
Effective measurement requires organizing KPIs into four distinct layers, each serving a specific purpose.
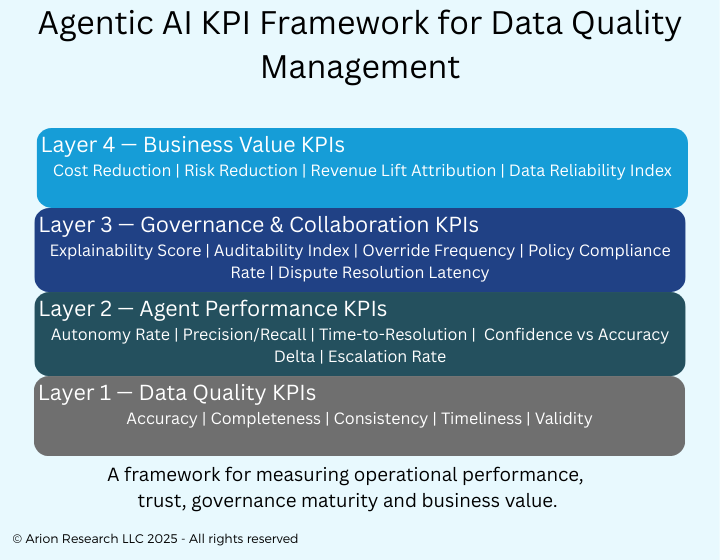
Layer 1: Data Quality Metrics (The Core Health Indicators)
These metrics measure the state of the data the agent is responsible for. They're familiar territory for most data teams, but they take on new meaning when agents are managing them.
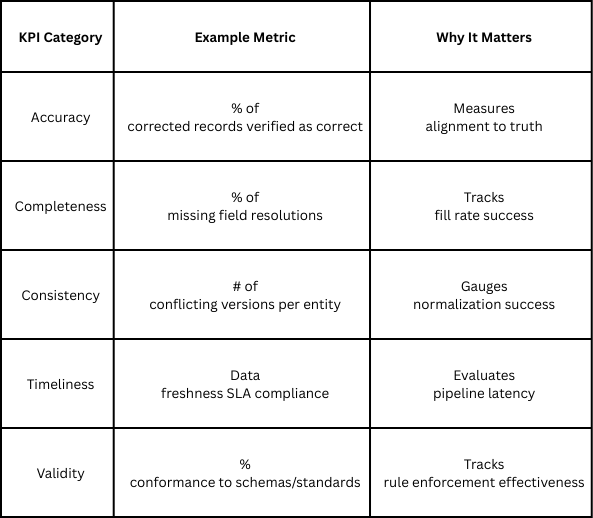
Here's a critical signal to watch: if data metrics improve but then plateau, the issue likely isn't data complexity. It's agent maturity or training limitations. This pattern suggests you need to invest in improving agent capabilities, not just running them longer.
Layer 2: Agent Performance Metrics (Behavior & Efficiency)
This layer focuses on how effectively and autonomously the agent operates. These metrics reveal the quality of agent decision-making and execution.
Key Performance Indicators:
Autonomy Rate: The percentage of data quality issues the agent resolves without requiring human approval. A healthy autonomy rate increases over time as the agent learns and gains trust. Declining autonomy may indicate model drift or exposure to new data patterns the agent hasn't been trained on.
Exception Escalation Rate: How often the agent defers control to human stewards. This should be contextual. High escalation on high-stakes financial data is appropriate. High escalation on routine formatting corrections suggests the agent needs better training.
Action Confidence Score: The agent's self-reported confidence in its actions, compared against verified accuracy. This is where things get interesting. High confidence paired with low accuracy is a governance risk that demands immediate attention. It suggests the agent is operating outside its competence zone without knowing it.
Detection Precision and Recall: The agent's ability to identify actual data quality issues without generating false positives. Precision matters because false positives waste human time and erode trust. Recall matters because missed issues create downstream problems.
Time-to-Resolution: Average latency from detecting an issue to implementing a correction. This metric reveals operational efficiency and helps identify bottlenecks in agent workflows.
These metrics together paint a picture of agent maturity. An agent with high autonomy, strong confidence-accuracy alignment, and fast resolution times is operating at peak effectiveness. Misalignment in any area signals where to focus improvement efforts.
Layer 3: Collaboration & Governance Metrics
Can we trust the agent? This layer measures compliance, auditability, and the quality of human-agent interaction.
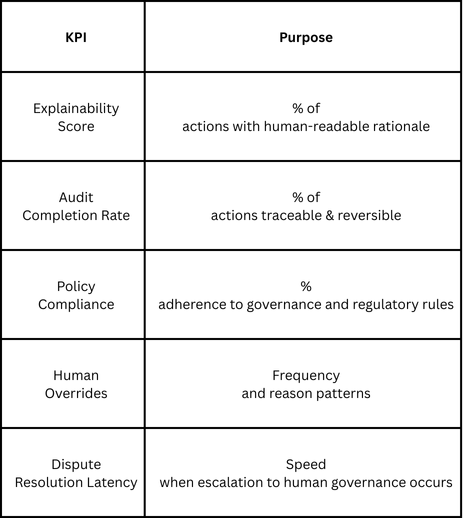
Explainability Score tracks whether the agent can articulate why it made specific decisions. In regulated industries, this isn't optional. Every data correction needs a clear, auditable rationale.
Audit Completion Rate measures whether you can trace every action back to its trigger and reverse it if needed. This is your safety net. When an agent makes a mistake, and they will, you need to be able to find it, understand it, and fix it quickly.
Policy Compliance ensures the agent operates within organizational and regulatory boundaries. An agent that achieves high accuracy while violating privacy policies or regulatory requirements isn't successful. It's a liability.
Human Overrides reveal patterns in where humans disagree with agent decisions. Analyzing override frequency and reasons helps you understand agent limitations and guides training priorities. Frequent overrides in specific data domains indicate where the agent needs improvement.
Dispute Resolution Latency tracks how quickly escalated issues get resolved when human governance is required. Long latencies create bottlenecks and reduce the operational value of agent automation.
Layer 4: Business Value Metrics (Outcome Alignment)
The ultimate test: is the agent generating measurable organizational value? Technical performance means nothing if it doesn't translate to business outcomes.
Cost Savings: Track reductions in manual data cleansing hours or third-party service spending. Quantify the difference between pre-agent and post-agent operational costs. Be realistic about transition costs and learning curves.
Revenue Lift: Measure opportunities that would have been lost due to bad data but weren't because the agent caught and corrected issues. This is harder to measure but critically important. Better data quality enables faster sales cycles, more accurate targeting, and fewer customer service issues.
SLA Improvement: Monitor whether analytics teams, operational systems, or external partners experience faster response times due to improved data reliability. Reduced time-to-insight is valuable even when hard to price.
Risk Reduction: Count fewer compliance violations, audit flags, or regulatory penalties attributable to data quality improvements. In regulated industries, this metric often justifies agent investment on its own.
User Satisfaction: Gather feedback from data stewards, analysts, and downstream system operators. Their qualitative experience matters. An agent that technically performs well but frustrates users creates organizational resistance.
An advanced metric to consider: develop a Data Reliability Index that combines stability, performance, and downstream trust into a single composite score. This gives executives a simple way to track overall data health while still maintaining granular metrics for operational teams.
Benchmarks and Targets: What "Good" Looks Like
Performance expectations should align with organizational maturity. A newly deployed agent won't match the performance of one that's been learning for months. Consider this maturity progression:
Initial Stage: Agent handles simple, high-confidence corrections. Autonomy rate: 20-40%. Heavy human oversight. Focus on building trust and establishing baselines.
Assisted Stage: Agent manages routine corrections independently. Autonomy rate: 40-70%. Escalates complex cases. Focus on expanding scope and improving accuracy.
Autonomous Stage: Agent handles majority of corrections. Autonomy rate: 70-90%. Human intervention on edge cases only. Focus on optimization and efficiency.
Optimized Stage: Agent proactively prevents issues. Autonomy rate: 85-95%+. Collaborative partner to humans. Focus on continuous learning and value expansion.
Benchmarks also vary by sector. Financial services typically demand higher accuracy thresholds (99%+ for transaction data) and lower autonomy rates due to regulatory requirements. Healthcare prioritizes explainability and audit completeness. Manufacturing often optimizes for speed and real-time correction.
Don't copy someone else's benchmarks blindly. Set targets based on your risk tolerance, regulatory environment, and business priorities.
Dashboards and Reporting Best Practices
Raw metrics don't drive action. Visualization and reporting cadence matter as much as metric selection.
Recommended Dashboard Components:
Use heat maps to show anomaly distribution across data domains. This reveals where quality issues cluster and helps prioritize agent training. A scatter plot comparing agent confidence against verified accuracy exposes calibration issues and overconfidence risks. Trend lines tracking governance compliance over time show whether agents are learning policy adherence or developing drift. Waterfall charts displaying business impact help executives understand value creation in tangible terms.
Reporting Frequency Guidance:
Data health metrics should be continuously monitored with real-time alerting for critical thresholds. Agent performance metrics deserve weekly review to catch drift early and adjust training. Business value metrics belong in monthly or quarterly reviews aligned with standard business cycles.
Match reporting depth to audience. Operational teams need granular, actionable metrics. Executives need high-level trends and business impact summaries.
Risks, Blind Spots & Anti-Patterns
Even well-designed KPI frameworks can mislead if you're not watching for these traps.
Over-optimizing for accuracy while ignoring trust creates agents that make perfect corrections but can't explain why, violating compliance requirements. Technical excellence without transparency is dangerous.
Optimizing autonomy without guardrails pushes agents to make more decisions independently before they're ready. High autonomy rates mean nothing if the agent is confidently making bad decisions.
KPI inflation through over-cleansing happens when agents correct data that doesn't need correction or apply excessive transformations to hit completeness targets. This degrades data utility while inflating performance metrics.
Hidden failure modes emerge in regulatory misalignment, systematic bias in correction patterns, or hallucinated corrections where agents invent data to fill gaps. These issues often don't show up in standard metrics until they cause serious problems.
Regular audits of agent decisions, not just outcomes, help catch these issues early.
Future Outlook: KPIs for Next-Gen Agent Ecosystems
As agentic AI matures, measurement frameworks will need to evolve. Multi-agent environments will require performance scoring that accounts for agent collaboration, not just individual capability. When multiple agents work together on data quality, we'll need metrics that capture coordination effectiveness and collective outcomes.
Reputation-based trust scoring between agents will emerge, where agents build track records that other agents can evaluate before accepting their corrections or recommendations. This creates accountability in agent ecosystems.
Cross-enterprise data quality trust exchange frameworks may develop, allowing organizations to share quality signals about common data sources without exposing sensitive information. Think of it as a credit rating system for data quality agents.
Self-improving KPI systems will use meta-learning to tune their own performance measurement approaches. Agents won't just improve data quality; they'll improve how we measure whether they're improving data quality.
Trustworthy Autonomy
Success in agentic data quality management isn't just about clean data. It's about trustworthy autonomy that creates sustainable business value.
The organizations that thrive in this new paradigm will be those that measure comprehensively across four dimensions: data state, agent behavior, collaboration quality, and business impact. They'll adapt their metrics as their agents mature, catching drift early and reinforcing success patterns.
Traditional data quality metrics remain important, but they're no longer sufficient. We need measurement frameworks that acknowledge the reality of agent decision-making, the importance of human-agent collaboration, and the ultimate test of business value creation.
As your agents evolve, so must your metrics. The question isn't whether to measure, but whether you're measuring what actually matters.