This is the tenth article in a 12-part series arguing that AI strategy and business strategy must be the same strategy. Each article examines a critical dimension of strategic AI alignment and includes a "Strategy Playbook" section with actionable guidance.
The Measurement Crisis
AI investment is accelerating. AI measurement is not keeping up.
The data is stark. Only 29% of executives say they can measure AI ROI confidently. Only 25% of S&P 500 companies could cite a quantifiable AI benefit in Q1 2026, up from 13% a year earlier but still a fraction of the 88% that report using AI in at least one function. 56% of CEOs report neither increased revenue nor decreased costs from AI in the past 12 months. Less than 1% of executives report ROI of 20% or greater, while 53% report only 1 to 5% returns.
The measurement crisis is not a technology problem; the AI works. The measurement infrastructure however, does not. Most organizations measure what is easy to track rather than what matters strategically. They count tokens processed, models deployed, and features shipped, then present these activity metrics as evidence of business impact. The result is what practitioners call "metrics theater": the organizational habit of tracking technical activity while ignoring the business outcomes that justify the investment.
Solving the measurement crisis requires shifting from operational metrics to strategic metrics, from activity indicators to outcome indicators, and from technology dashboards to business impact frameworks. The prior articles in this series established that AI strategy must be business strategy. This article addresses the corollary: AI measurement must be business measurement.
Operational Metrics Are Necessary but Insufficient
Operational metrics have their place. Cost per token, inference latency, uptime, tickets deflected, documents processed, time saved per task: these are the instrumentation that keeps AI systems running. They answer the question "Is the system performing?" and every AI deployment needs them.
The problem is that most organizations stop here. They measure AI performance without measuring AI impact. They track system efficiency without connecting it to business outcomes. And they report these operational metrics to executives and boards as though they answer the strategic question, which is not "Is the system performing?" but "Is the investment creating competitive advantage?"
The distinction matters because operational excellence and strategic impact are not the same thing. An AI system can deflect 40% of support tickets with 95% customer satisfaction and still be strategically irrelevant if customer support was never a competitive differentiator for the organization. Conversely, an AI system with modest operational metrics might be strategically decisive if it enables a new revenue model or accelerates product development in ways competitors cannot replicate.
The 93/7 budget split from Part 1, with 93% allocated to technology and 7% to people, has a measurement analog. Most organizations allocate the vast majority of their measurement effort to technology metrics and a fraction to business impact metrics. The result is the same: a disconnect between investment and outcomes, visible in the data but invisible in the dashboard.
A Strategic Measurement Framework
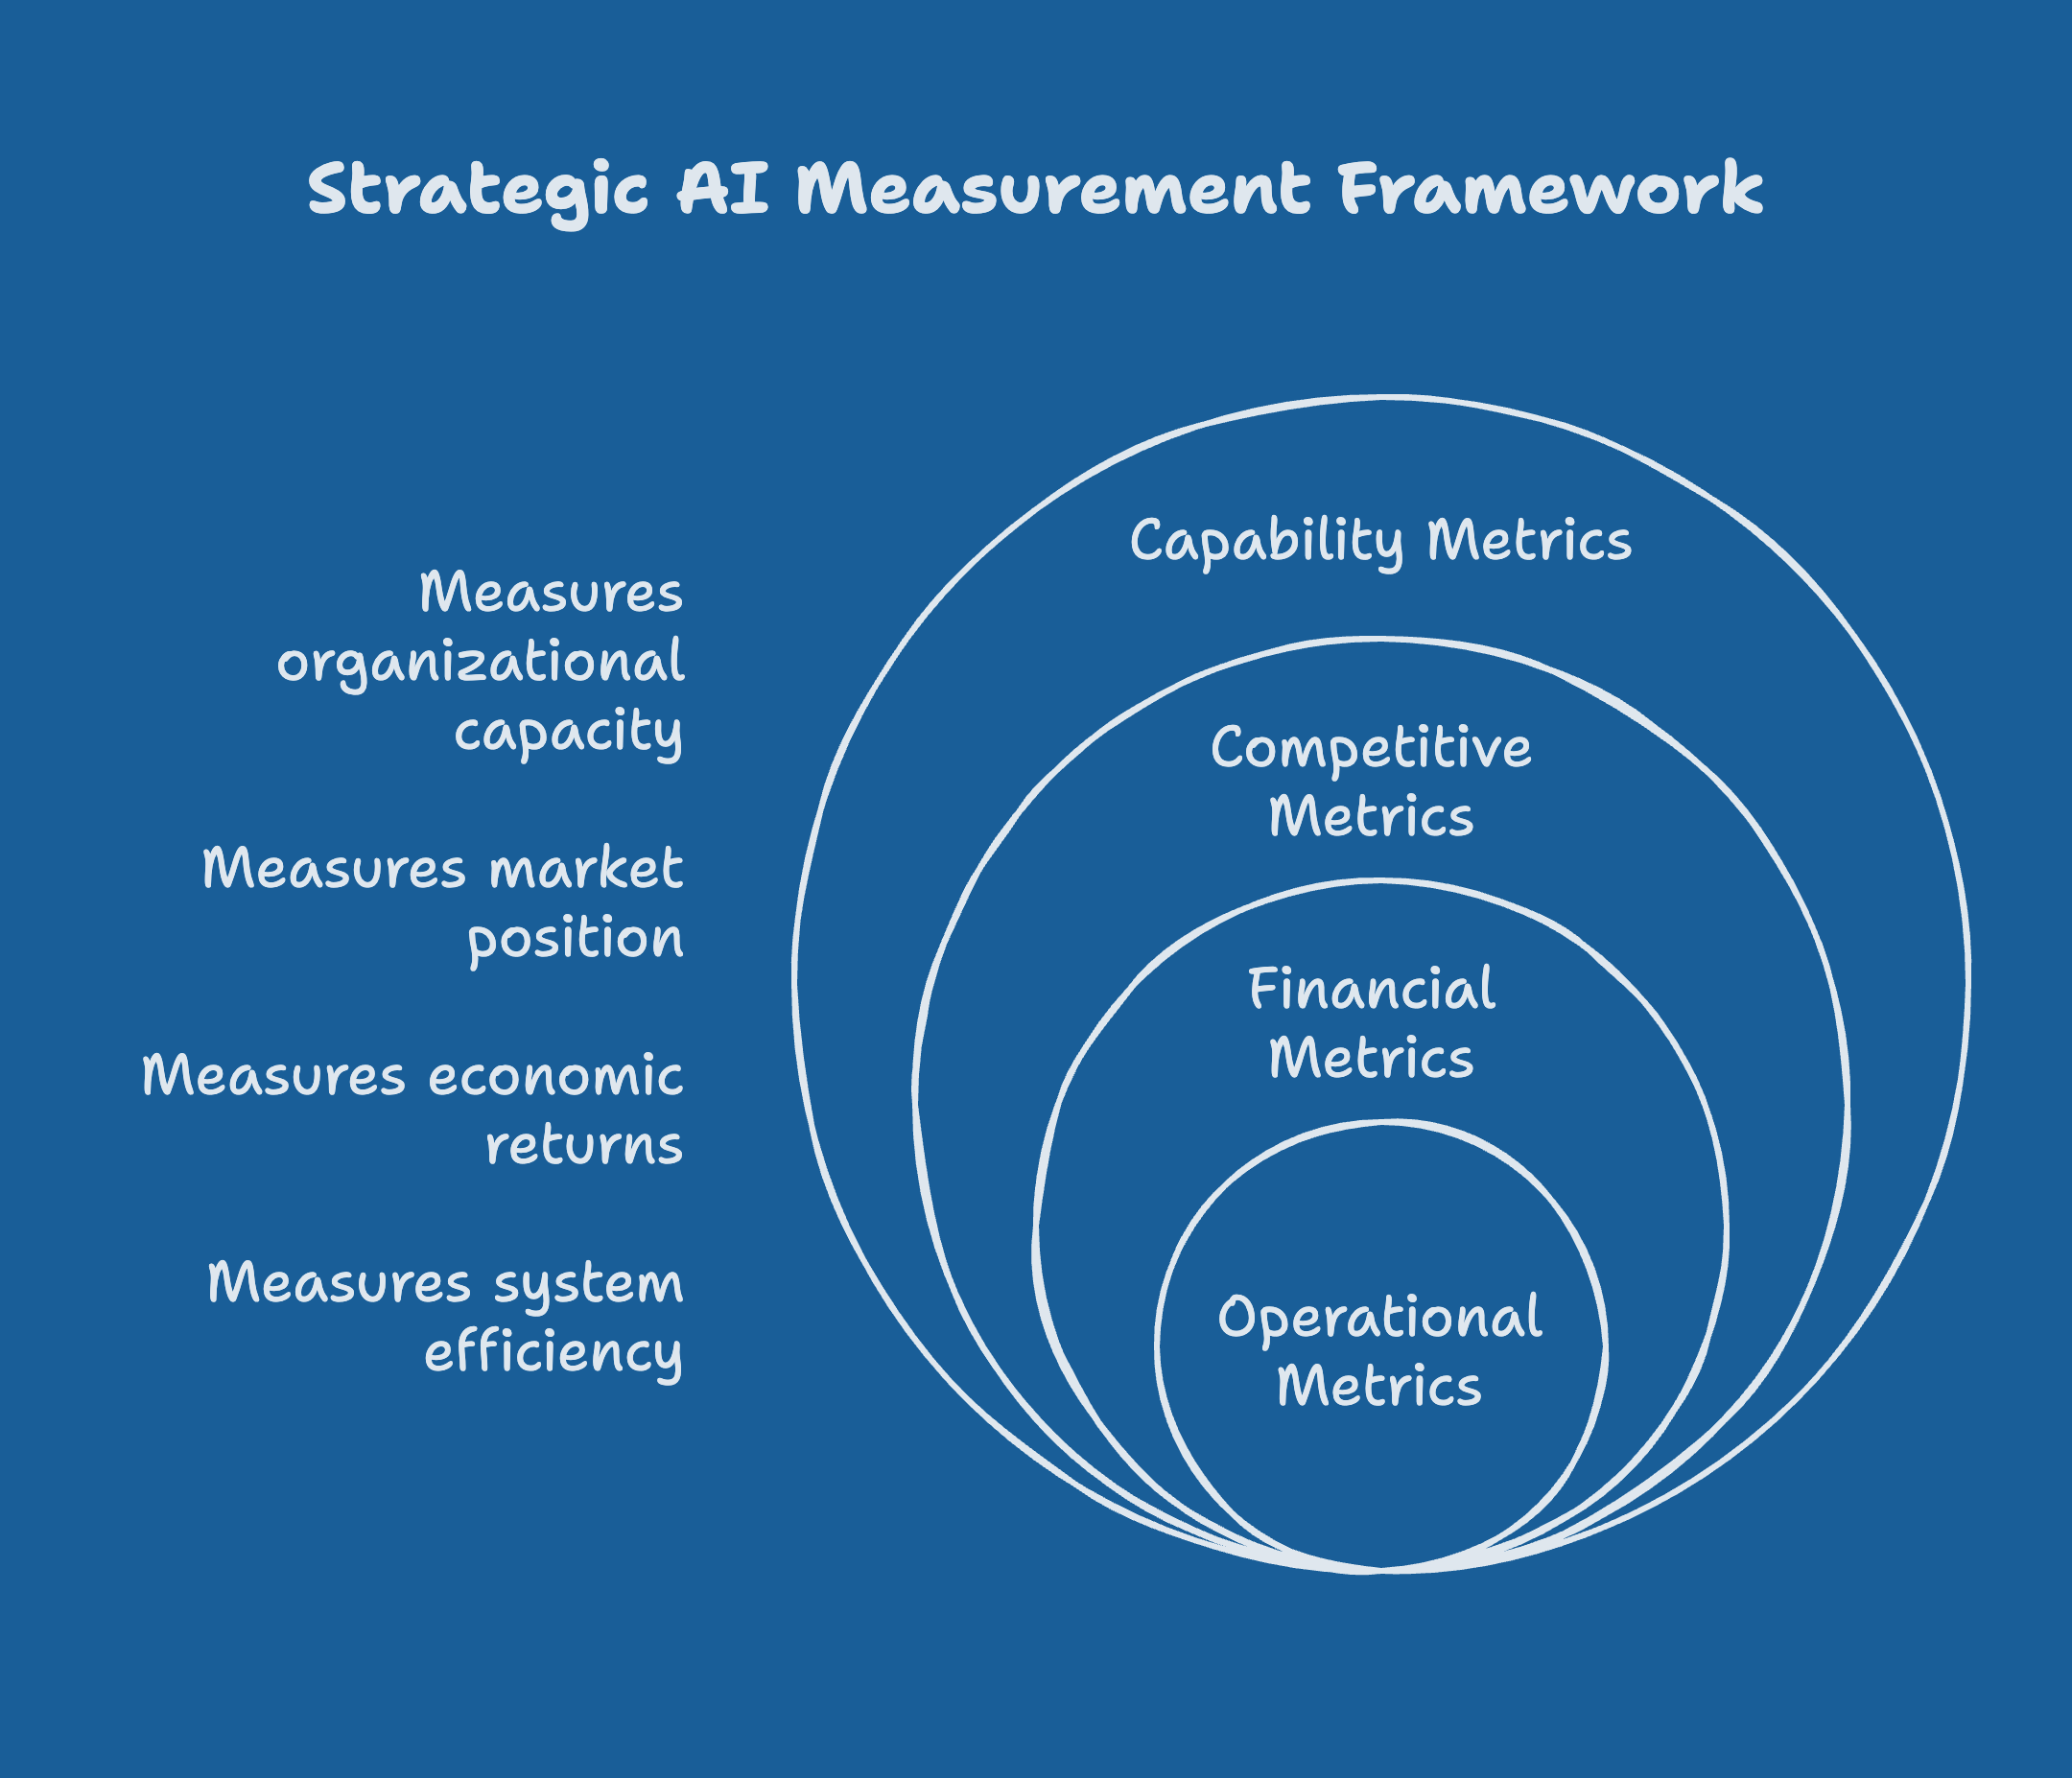
Strategic AI measurement requires a four-tier framework that connects technology performance to business outcomes.
Tier 1: Operational metrics. These measure process efficiency and system performance. Examples include cost per transaction, processing speed, error rates, system availability, and throughput. Every AI deployment needs Tier 1 metrics. They are the foundation, but they are not the building. Tier 1 answers: "Is the AI system working as designed?"
Tier 2: Financial metrics. These measure the direct economic impact of AI investments. Revenue impact (new revenue enabled, revenue acceleration, cross-sell and upsell lift), cost reduction (labor cost savings, process cost reduction, error cost avoidance), and productivity gains (output per employee, cycle time reduction, capacity increase). Tier 2 connects AI to the P&L. It answers: "Is the AI investment generating financial returns?"
Tier 3: Competitive metrics. These measure AI's impact on market position and customer relationships. Market share movement, customer acquisition cost, customer lifetime value, Net Promoter Score, competitive win rates, speed to market, and pricing power. Tier 3 connects AI to competitive advantage. It answers: "Is the AI investment strengthening our market position?"
Tier 4: Capability metrics. These measure organizational learning, talent development, and strategic capacity. Orchestration maturity (the progression from Parts 1 through 5 of the orchestration series), workforce AI proficiency across the four skill levels from Part 8, data asset quality and growth, governance maturity, and innovation pipeline health. Tier 4 connects AI to long-term organizational capability. It answers: "Is the AI investment building durable advantages that compound over time?"
Strategic AI Measurement
Most organizations measure only Tier 1, some measure Tier 2, few measure Tier 3, and almost none systematically measure Tier 4. Yet the strategic value of AI accrues primarily at Tiers 3 and 4. The learning flywheel from Part 4, the data moat from Part 6, and the talent advantage from Part 8 are all Tier 4 phenomena. They are the compounding advantages that separate AI leaders from laggards, and they are the advantages that most measurement frameworks miss entirely.
Organizations that systematically track AI performance metrics across all four tiers achieve 3.5 times greater ROI from their AI initiatives than those that do not. The measurement framework itself is a competitive advantage.
Leading and Lagging Indicators
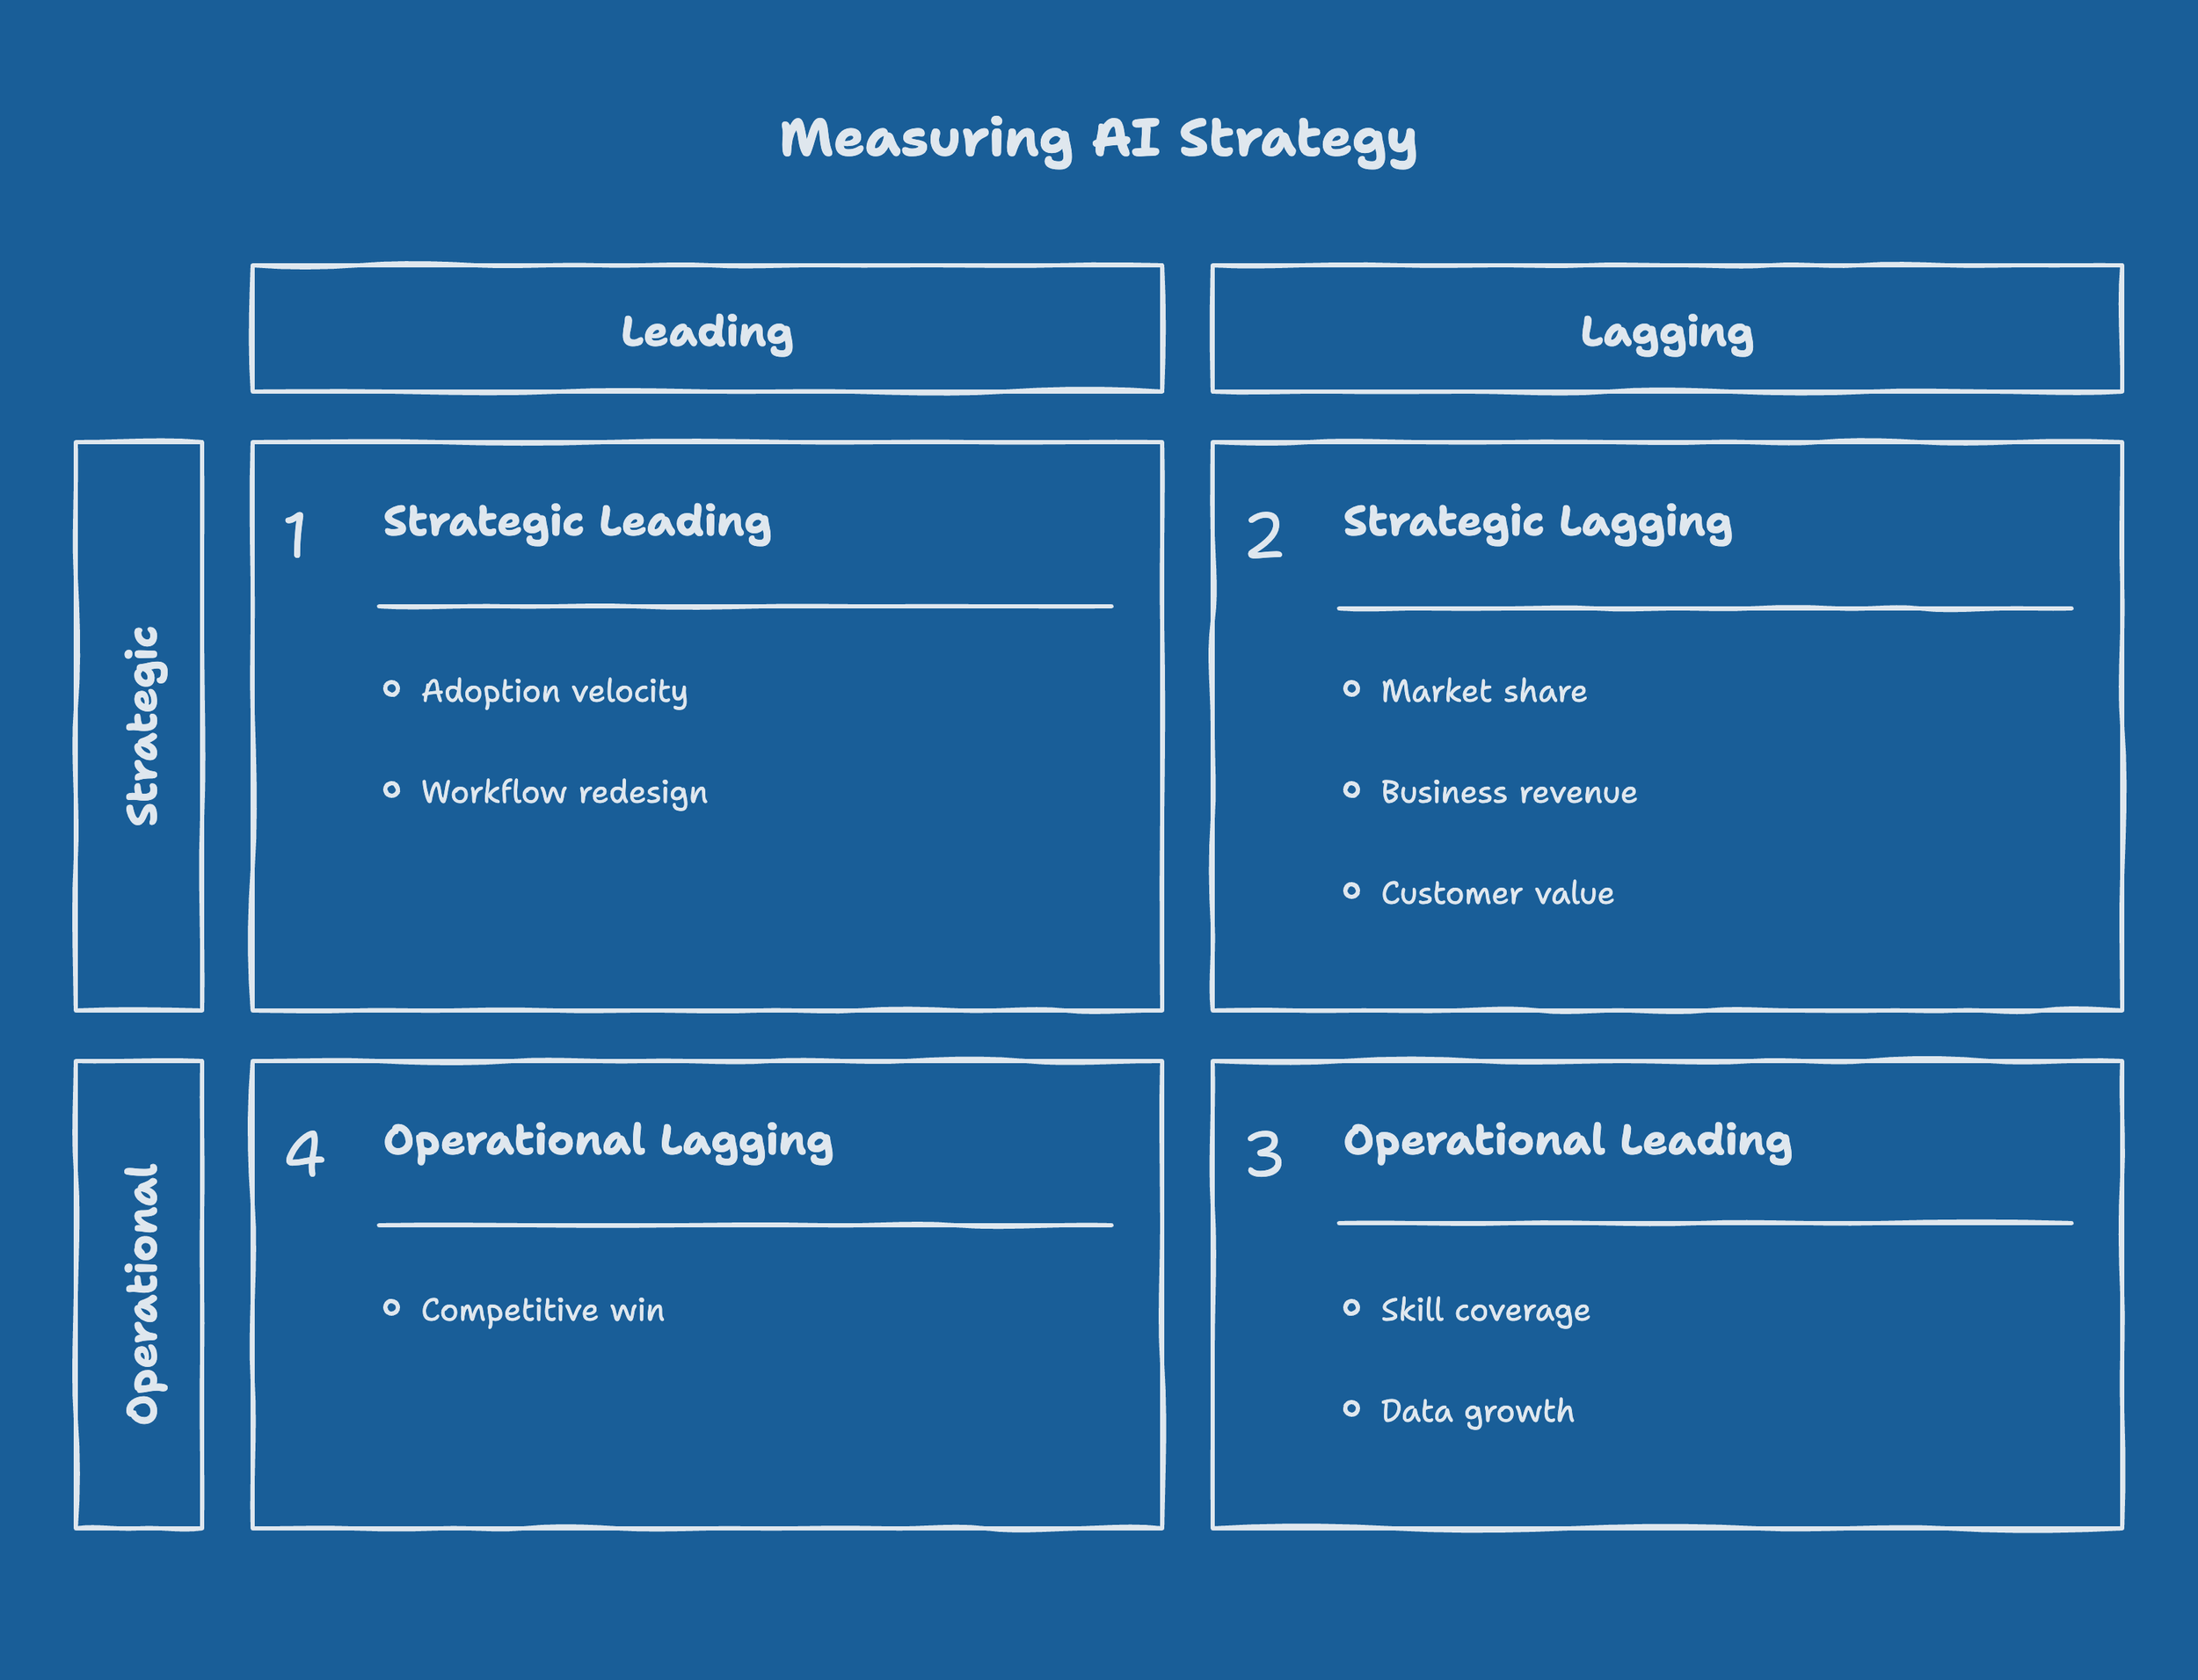
Within each tier, organizations need both leading indicators (what to measure early) and lagging indicators (what to measure later). Leading indicators predict future performance. Lagging indicators confirm past performance. A measurement framework with only lagging indicators tells you where you have been but not where you are going.
Leading indicators for AI strategy include:
Adoption velocity: not just how many people are using AI tools, but whether usage is growing, plateauing, or declining. AI adoption follows a predictable curve with a dangerous middle zone called the "plateau trap," where organizations see rapid early adoption followed by a stall well below potential. Tracking the trajectory weekly reveals whether the organization is on track before the quarterly numbers confirm or deny it.
Skill development coverage: what percentage of the workforce has completed AI training at each of the four proficiency levels from Part 8. Organizations with formal AI training programs achieve 2.3 times faster adoption and 67% higher ROI. But only 18% of organizations regularly measure skills throughout the development journey, and most rely on course completions, a lagging and unreliable indicator of actual capability.
Workflow redesign coverage: what percentage of strategic workflows have been redesigned to incorporate AI, not just augmented with AI tools bolted onto existing processes. This was the critical differentiator from Part 1: BCG found that employees at companies pursuing workflow redesign are 24 percentage points more likely to see measurable business impact.
Data asset growth: the rate at which proprietary operational data, the competitive moat from Part 6, is accumulating and being incorporated into AI systems. This is a leading indicator of future competitive advantage because the learning flywheel's compounding returns depend on data volume and quality.
Lagging indicators for AI strategy include:
Market share movement: changes in competitive position attributable to AI-enabled capabilities. This takes time to materialize and is subject to multiple confounding factors, but it is the ultimate measure of whether AI is creating competitive advantage.
Business model revenue: the percentage of revenue coming from AI-enabled products, services, or business models. This measures the transformation thesis from Part 5, and it is a lagging indicator because new business models take time to reach scale.
Competitive win rate: whether the organization is winning more competitive deals, and whether AI-enabled capabilities are cited as a factor. This is particularly relevant for the experience-first and growth-first archetypes from Part 2.
Customer lifetime value trajectory: whether AI is deepening customer relationships in ways that increase retention and expand spending over time. This is a lagging indicator that confirms whether the customer experience improvements are translating to durable economic value.
The measurement cadence should match the indicator type. Leading indicators weekly or monthly. Lagging indicators quarterly or annually. Confusing the two, expecting lagging indicators on a monthly cadence or ignoring leading indicators until the quarter closes, produces either premature panic or delayed recognition of problems.
Measuring AI Strategy
The Attribution Challenge
The hardest problem in AI measurement is attribution: connecting AI investments to business outcomes when AI is one of many contributing factors.
A sales team closes a large deal. The AI-powered research tool provided competitive intelligence. The AI-generated proposal draft saved three days. The AI-enabled pricing optimization suggested the winning bid. But the salesperson's relationship, the product's fit, and the competitor's misstep also mattered. How much of the win is attributable to AI?
Most organizations solve this problem by not solving it. They either claim full attribution (every win is an "AI win") or no attribution (AI's contribution cannot be isolated, so it is not measured). Both approaches are wrong. Full attribution inflates the case for AI investment. No attribution undermines it.
Three methodological approaches offer practical alternatives.
The counterfactual approach. Compare outcomes for teams, regions, or business units using AI against those not yet using it. This is the closest to experimental design in an enterprise setting. Traditional A/B testing often breaks in enterprise AI rollouts because organizations deploy in waves rather than randomly, but techniques like synthetic control methods and difference-in-differences estimation can produce valid causal estimates even in staged rollouts. The key requirement is that the organization preserves a control group long enough to establish a valid comparison, resisting the pressure to deploy everywhere simultaneously.
The contribution analysis approach. Rather than claiming full attribution, assess AI's contribution as one factor among several. Survey the participants in a process (sales team members, customer service agents, product developers) about AI's perceived contribution, then validate with quantitative data. This produces a contribution %age rather than a binary attribution. It is less precise than experimental methods but far more practical at scale, and it avoids the false precision of claiming exact %ages.
The capability-based approach. Some AI impacts cannot be attributed to specific outcomes because they enable capabilities that did not previously exist. If an AI system enables the organization to offer personalized pricing at scale, and competitors cannot match this capability, the attribution question is not "How much revenue did AI generate?" but "Would this revenue exist without AI?" This counterfactual framing captures the strategic value of capabilities that create new possibilities rather than optimizing existing ones.
The attribution methodology should match the investment type. Efficiency investments (Tier 1 and 2 metrics) are relatively straightforward to attribute using before-and-after comparisons. Growth investments (Tier 3 metrics) require contribution analysis. Transformation investments (Tier 4 metrics) require capability-based assessment. Using the wrong methodology for the investment type produces either false precision or false humility.
Executive Reporting
The CEO, CFO, and board do not need an AI technology dashboard. They need a strategic AI impact report that answers four questions: Is the AI portfolio creating value? Is the value accruing in the right places? Are we building durable advantages? What decisions need to be made?
Half of CEOs now believe their job stability depends on getting AI investments right. The metric of 2025 was "users." The metric of 2026 is "auditable outcomes." This shift means executive reporting must evolve from technology activity reports to business impact reports.
What the CEO needs: A strategic view connecting AI investments to competitive position, market share, and long-term capability development. The CEO's question is not "How many AI models are deployed?" but "Are we winning because of AI?" The CEO dashboard should show Tier 3 and Tier 4 metrics: competitive win rates, market share trajectory, customer lifetime value trends, organizational capability maturity, and strategic portfolio balance.
What the CFO needs: A financial view connecting AI investments to revenue, cost, margin, and return on invested capital. The CFO's question is not "What did we spend on AI?" but "What did we get for what we spent?" The CFO dashboard should show Tier 2 metrics alongside investment data: revenue impact per dollar invested, cost reduction as a percentage of AI spend, payback periods for major AI investments, and the AI spending efficiency index from Part 7. Less than 1% of executives report ROI of 20% or greater, which means the CFO's dashboard should present realistic expectations and trajectory rather than cherry-picked wins.
What the board needs: A governance and risk view alongside the strategic value view. The board's questions are "Are we taking the right risks?" and "Are we building the right capabilities for the long term?" The board dashboard should combine Tier 3 and 4 metrics with the risk assessment from Part 9: governance maturity, regulatory compliance posture, vendor dependency, and competitive position relative to industry AI adoption curves.
The common mistake is presenting all three audiences with the same report. The CEO, CFO, and board need different views of the same underlying data, filtered for their respective decision contexts. A single "AI dashboard" that tries to serve all three audiences serves none of them well.
The reporting cadence matters as much as the content. Monthly financial reviews should include Tier 2 AI metrics alongside other investment performance data, normalizing AI as a business investment rather than treating it as a separate technology category. Quarterly strategic reviews should address Tier 3 and 4 metrics and portfolio decisions. Board reporting should be quarterly, with the strategic risk assessment from Part 9 presented alongside the value creation data. The goal is to embed AI measurement into existing business review rhythms rather than creating a parallel reporting structure that executives treat as optional.
Avoiding Measurement Theater
Measurement theater is the organizational practice of presenting metrics that look impressive but do not reflect actual business impact. It is widespread, and it is corrosive because it prevents organizations from identifying and correcting strategic AI failures until the failures become obvious in the P&L.
The most common forms of measurement theater:
Vanity metrics. Model accuracy, deployment count, tokens processed, number of "AI-powered" features, user logins. These measure activity, not impact. An organization that deploys 50 AI models and processes a billion tokens per month has demonstrated technical capacity, not business value. The 39 to 44% measurement accuracy gap between perceived and actual productivity gains in enterprise AI means that even well-intentioned teams often overestimate impact.
Cherry-picked case studies. Selecting the three most successful AI implementations and presenting them as representative of the entire portfolio. This is the AI equivalent of survivorship bias: the case studies are real, but they misrepresent the portfolio's overall performance. The honest portfolio view, including the 42% of projects abandoned and the pilots that produced no measurable return, is less impressive but more useful for decision-making.
Proxy-metric drift. Starting with a meaningful business metric, discovering it is hard to measure, substituting an easier proxy, and then optimizing the proxy until it stops correlating with the outcome it was supposed to represent. Course completion rates as a proxy for skill development is a common example. Adoption rates as a proxy for business impact is another. The proxy becomes the target, and the original business question goes unanswered.
Benchmark gaming. Optimizing AI systems for benchmark performance rather than real-world performance. This is more common in model selection than in business measurement, but it appears in enterprise settings when teams optimize for demonstration scenarios rather than production conditions. The demo works perfectly; the production deployment delivers modest results.
The antidote to measurement theater is accountability: connecting AI metrics to named individuals who are responsible for specific business outcomes, with consequences for missing targets and rewards for exceeding them. The orchestration series argued for outcome owners with authority, budget, and accountability. The same principle applies to measurement: metrics without accountable owners become decoration.
Strategy Playbook
The four-tier measurement framework. Design metrics for each tier with specific targets, measurement methods, and review cadences. Tier 1 (operational): identify 5 to 7 operational metrics per AI deployment, measured continuously with automated monitoring, reviewed weekly by the technical team. Examples include system availability (target 99.5% or higher), average response time, error rate, cost per transaction, and throughput. Tier 2 (financial): identify 3 to 5 financial metrics per strategic AI initiative, measured monthly with finance team validation, reviewed monthly by the AI portfolio owner. Examples include revenue directly enabled by AI capabilities, labor cost reduction from AI automation, process cost reduction, and ROI per initiative. Tier 3 (competitive): identify 3 to 4 competitive metrics for the overall AI portfolio, measured quarterly with competitive intelligence input, reviewed quarterly by the executive team. Examples include competitive win rate (with AI contribution analysis), customer acquisition cost trend, customer lifetime value trend, and speed to market for AI-enabled offerings. Tier 4 (capability): identify 3 to 4 capability metrics for the organization, measured quarterly with HR and learning team input, reviewed semi-annually by the CEO and board. Examples include workforce AI proficiency distribution across the four skill levels, data asset quality score and growth rate, orchestration maturity progression, and governance maturity score. For each metric, define: what is measured, how it is measured, who is accountable, what the target is, and what action is triggered if the target is missed. Metrics without accountability are decoration.
The strategic AI dashboard. Build three views of a single underlying dataset. The CEO view shows four to six Tier 3 and Tier 4 metrics on a single page: competitive position trajectory (win rates, market share), capability maturity progression, portfolio balance (efficiency versus transformation investment), and strategic risk posture. Updated quarterly, reviewed in the quarterly strategic AI review. The CFO view shows four to six Tier 2 metrics alongside investment data: AI spending efficiency index (ratio of business outcomes to AI investment), revenue and cost impact by portfolio category, payback periods and projected returns for major initiatives, and budget variance and reforecast. Updated monthly, reviewed in the monthly finance review. The board view combines the CEO and CFO views with governance and risk data: regulatory compliance status across jurisdictions, governance maturity versus deployment pace, vendor concentration and dependency risk, and talent pipeline health. Updated quarterly, presented at each board meeting alongside the strategic risk assessment from Part 9. Each view should fit on a single page. If it requires scrolling, it contains too much information. Executives make decisions from patterns, not from data density.
Attribution methodology. For each AI initiative, select the appropriate attribution method based on investment type. For efficiency investments (automating existing processes), use before-and-after comparison: measure the process metric before AI deployment, measure it after, and attribute the difference. Control for other changes (staffing, volume, seasonal effects) by comparing against a similar process or time period without AI. For growth investments (enabling new revenue or market expansion), use contribution analysis: survey participants quarterly on AI's perceived contribution (0 to 100% scale), validate against quantitative data (did deals with AI-assisted proposals close at a higher rate?), and report a contribution range rather than a point estimate. For transformation investments (new business models or capabilities), use capability-based assessment: identify capabilities that exist only because of AI, estimate the revenue or competitive advantage those capabilities enable, and present as "revenue enabled by AI capability" rather than "revenue caused by AI." Document the methodology for each initiative so that the board can evaluate the rigor of the measurement, not just the numbers.
The quarterly strategic AI review. Conduct a 90-minute session with the CEO, CFO, CAIO (or equivalent), and business unit leaders. Agenda: portfolio performance review (30 minutes), covering each initiative's Tier 2 and 3 metrics, trend versus target, and contributing factors for over- or under-performance. Competitive position assessment (15 minutes), covering changes in competitive dynamics, new AI-enabled threats or opportunities, and comparison against the scenario planning from Part 9. Capability maturity update (15 minutes), covering workforce proficiency progression, data asset development, governance maturity advancement, and orchestration capability evolution. Portfolio rebalancing decisions (20 minutes), covering which initiatives to kill, scale, or redirect based on the portfolio governance framework from Part 7, resource reallocation proposals, and new investment opportunities. Forward-looking indicators (10 minutes), covering leading indicators that signal emerging opportunities or risks and early warnings from adoption velocity, skill development, and data asset metrics. The review produces three outputs: a decision record (what was decided and why), an action list (who does what by when), and an updated portfolio scorecard (the current state of the AI investment portfolio). Distribute all three within 48 hours. Decisions deferred are decisions defaulted.
This article is the tenth in the "AI Strategy is Business Strategy" series. For the companion frameworks from all prior series, including the Dual Maturity Quick Diagnostic and Agentic AI Readiness Assessment, visit arionresearch.com. The themes of strategic alignment, governance-by-design, and orchestration architecture will be developed further in the forthcoming "Governance-by-Design" book. Follow Arion Research for ongoing analysis at arionresearch.com/blog.